DateWise, Ltd
How to count distinct clients seen
Vic Fanberg, December 2, 2017
I have seen as much as a 25% variance in the quantity of distinct clients seen for the same basic year depending on the exact dates chosen. It doesn’t matter whether you are using Medicat, Point and Click, Pyramid, Titanium Schedule, or any other software. One embedded report might say 4,000 distinct clients, but then change the dates about 6 or 8 weeks, and the same report might say 5,000 distinct clients. The cause of this issue is that causes this is that you are including people from partial terms (i.e., quarter, semester or year).
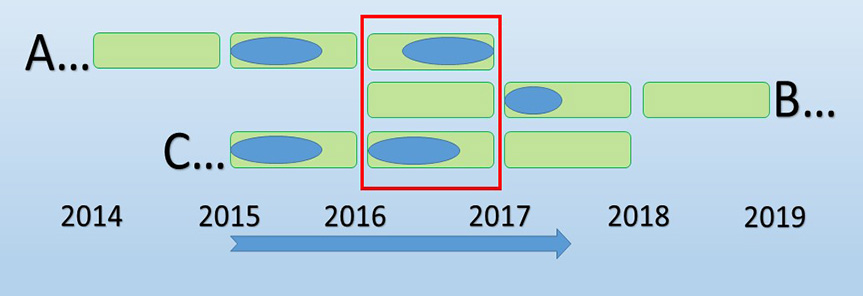
To visually see the problem, consider the following diagram. It shows the schedules of 3 students (A, B and C). The green boxes represent years, which are labeled along the timeline at the bottom. Student A graduated at the end of the term ending in 2017. Student B started school in 2016. Student C graduates at the end of the term ending in 2018. The blue ovals represent the date ranges when the counseling center saw the student. The red box represents a 1-year term in which we are trying to count how many distinct clients were seen. The first illustration shows just student A and student C were seen during the one year period starting in 2016 and ending in 2017.
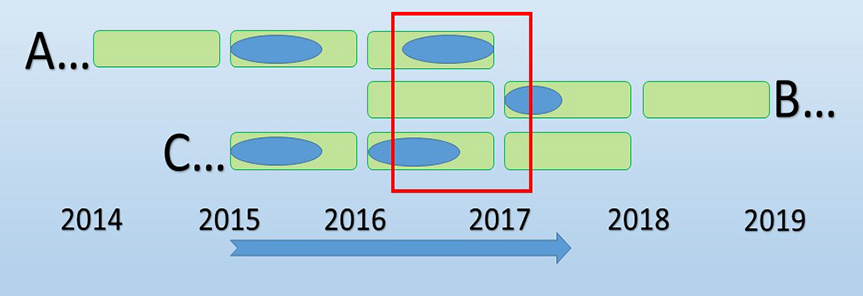
Watch what happens if we pick a date range a little after the previous one. Now the red box contains appointments for all 3 students. The count of distinct clients seen would say 3 students, even though only 2 students were really seen during the 2016-2017 academic year. So, it is now easy to see how easy it is to create a large error in the count of distinct clients seen (here it is a 33% overstatement).
The majority of students start their school experience in the fall and end their school experience after the spring term in some future year. Students also take more classes during fall and spring terms than over the summer. Finally, I noticed that students who start counseling (such as group sessions) in the fall have a higher tendency to continue counseling in the spring, as opposed to students who start counseling in the spring tending to continue counseling in the summer or fall. All of this means that the same effect as shown above happens if you calculate the quantity of students at the beginning of spring term rather than the quantity of students at the beginning of fall term.
In general, the closer you get to the center of a term, the worse the distortion will be. This is especially true of the center of quarters or semesters, but even, to a lesser effect, the center of years. So, if you are only looking a day or two into the start of a year, the only distortion is going to be from a few of the clients seen in the first day or two of the added year. Likely any clients with an appointment in the first day or two of the cut short year will have some other appointment that year, so will not be subtracted from the count as easily as new term specific clients will be added.
If you would like to verify this effect with your own data, run a report that gives the quantity of distinct clients seen for the following date ranges, and see if they come close to matching:
- The first day of fall semester in 2016 for a full one-year period
- One week after the first day of fall semester in 2016 for a full one-year period
- Two weeks after the first day of fall semester in 2016 for a full one-year period
- Three weeks after the first day of fall semester in 2016 for a full one-year period
- Four weeks after the first day of fall semester in 2016 for a full one-year period
- and so on until you convince yourself
So, how do you get the closest to an accurate count of distinct clients seen?
- The closest to an accurate count of distinct clients seen during the school year will be the 12-month period starting after the end of summer term and before the beginning of fall term that gives the fewest clients when calculated. In other words, if your summer term ends on August 18, 2017, and fall term begins August 28, 2017, use your EMR reports to calculate the quantity of distinct clients seen for a 1-year period ending on each of the following dates (and the one that gives the lowest number is the best estimate of the quantity of distinct clients seen): 8/18, 8/21, 8/22, 8/23, 8/24, 8/25 and 8/28.
- If you must count clients for some other period, just report the difference how much different it is from one year to the next year rather than raw numbers. For example, if you are asked for the number of distinct clients seen between 1/1/2016 and 12/31/2016, report how that compares with the clients seen between 1/2/2015 - 12/31/2015, instead of reporting raw numbers (assuming the goal is to look for growth in demand for counseling services). If the goal is to get raw counts of clients seen for the year, give the counts for the clients seen starting at beginning of fall term instead because this is more accurate.
- Whenever I reported distinct clients seen for a year period, I also always specified the exact date range I had used right along with the raw count. That allowed me to reproduce the numbers later on, or provide further details for the matching count.